Research Projects
Pulsations of TESS’s Coolest Main Sequence Dwarf
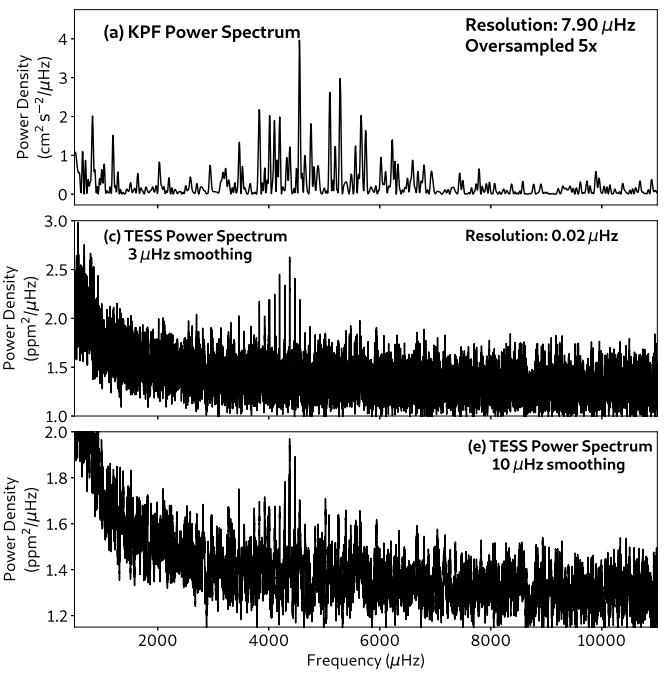
σ Draconis is a nearby K-dwarf that is a prime target for the searches for an Earth-like planet from the Habitable Worlds Observatory. Curiously, it is likely the star with the highest pulsation frequences and lowest amplitudes to have solar-like oscillations clear detected by TESS data.
In this work, we also present the first asteroseismic results from the Keck Planet Finder, showing that while our photometry may be unable to detect these low-amplitude oscillations, our next-generation precision radial velocity instruments surely can!
Emulating Stellar Evolutionary Grids with Normalizing Flows
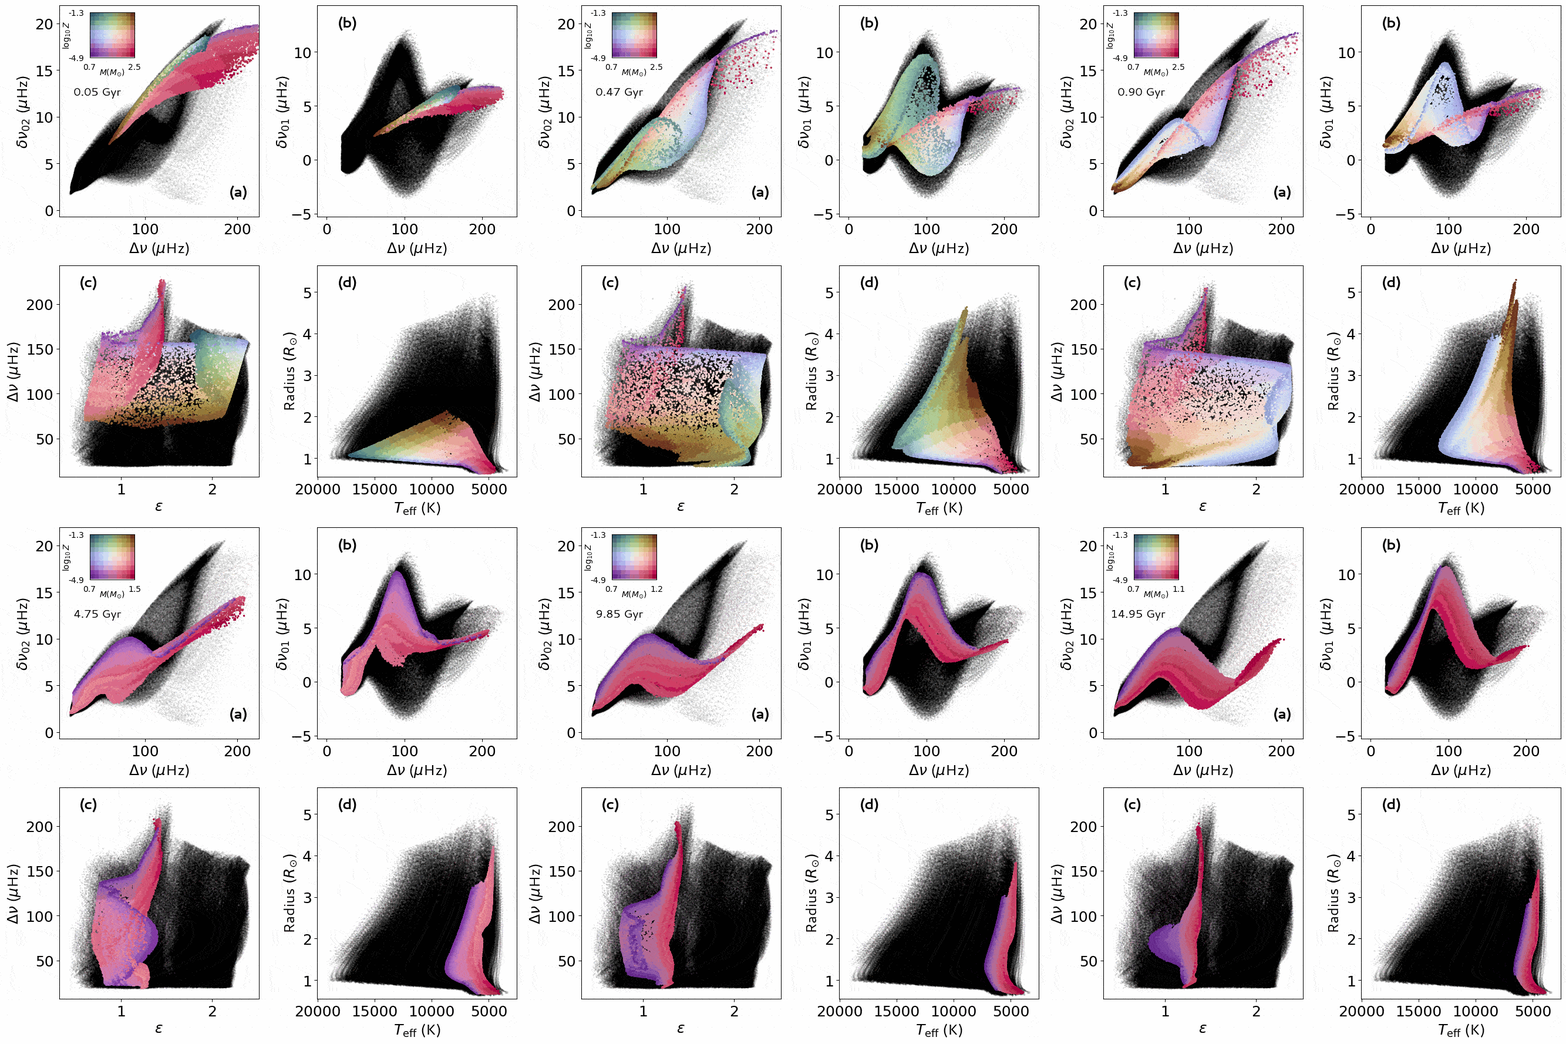
We often rely on interpolating multi-dimensional grids of stellar evolution models to infer the fundamental properties of stars like their masses and age. These grids can be incredibly expensive to generate in high dimensions, often resulting in incredibly sparse grids not well-suited for interpolation. In this study, we train normalizing flows, a generative deep learning model, to emulate these high-dimensional distribution of stellar grids to act as powerful and accurate interpolators. Their interpolations are useful substitutes over the standard Markov Chain Monte Carlo approaches, are smooth over the domain, and make for terrific visualizations.
Discovery of a Planet Escaping Engulfment
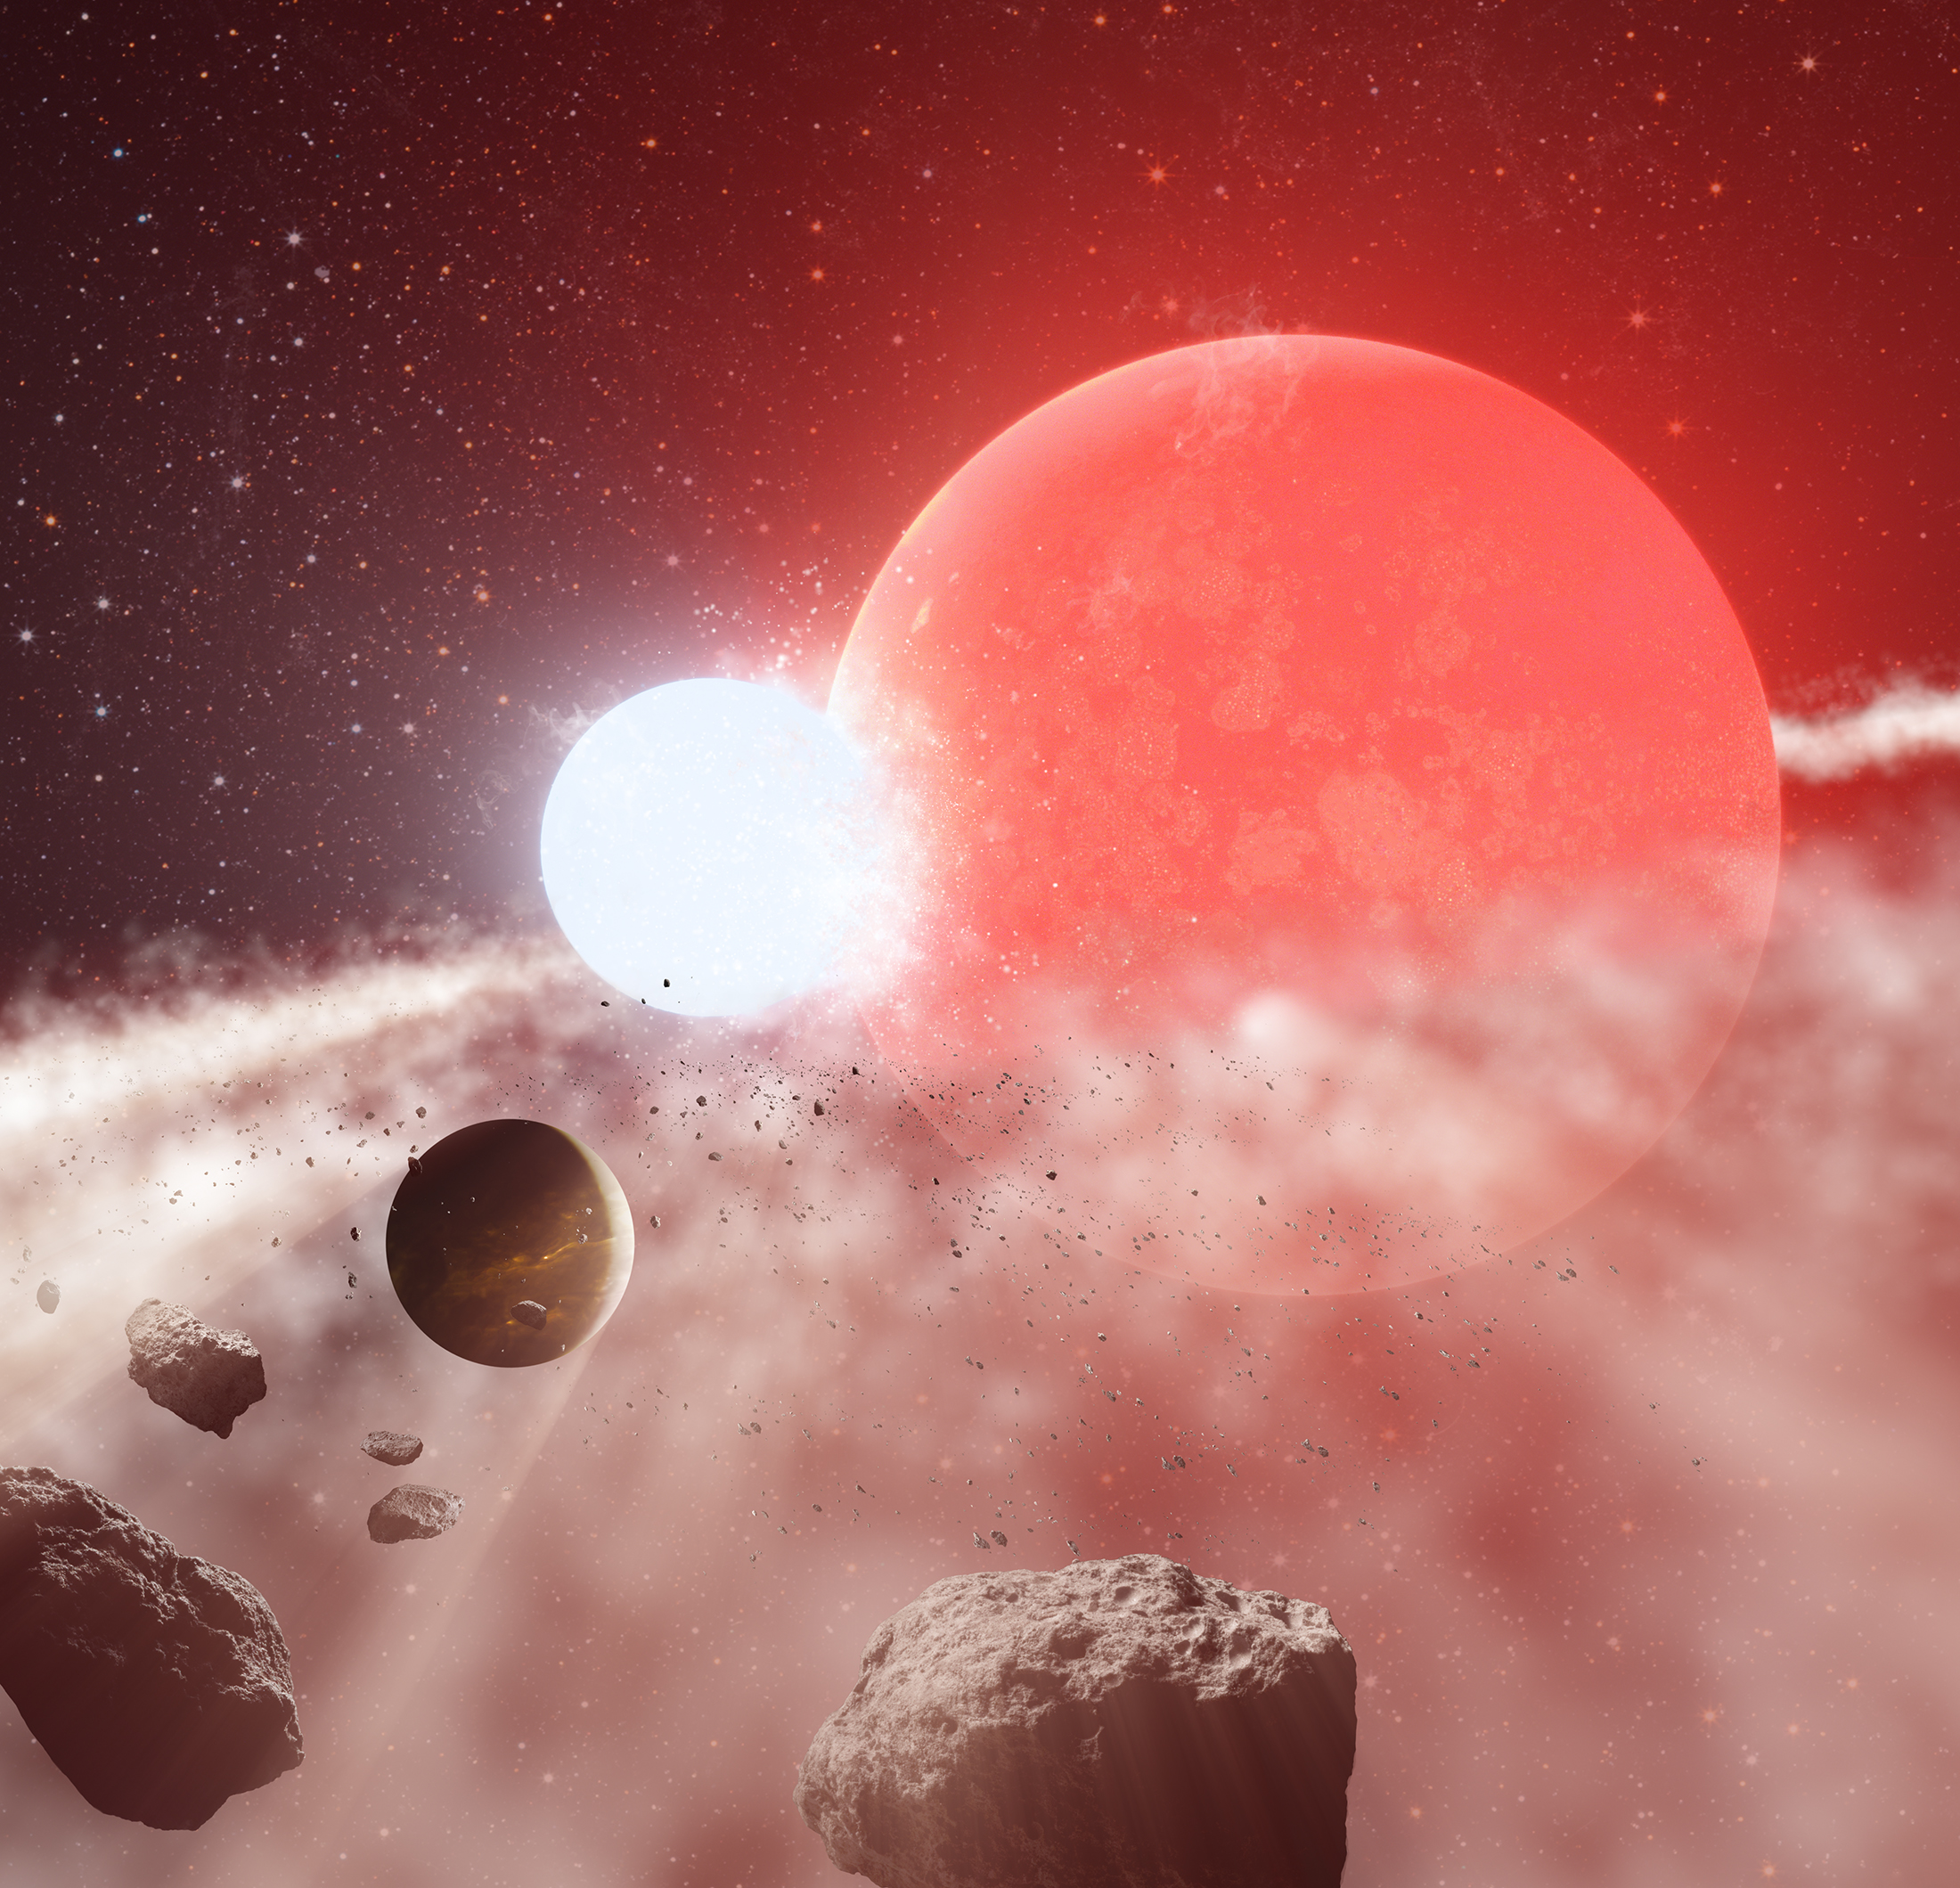
We reveal the first discovery of a planet escaping engulfment from its host star up the red giant branch. The planet Halla (8 UMi b) orbits its host star Baekdu (8 UMi) perilously close at a distance of only 0.5 AU. We discover that Baekdu is a red clump star, implying that it should have once been sufficiently large to engulf Halla. In this study published in Nature, we explore the unexpected survival of Halla, which suggests a unique survival pathway involving a binary star history for Baekdu.
The Henry Draper-TESS (HD-TESS) Catalog
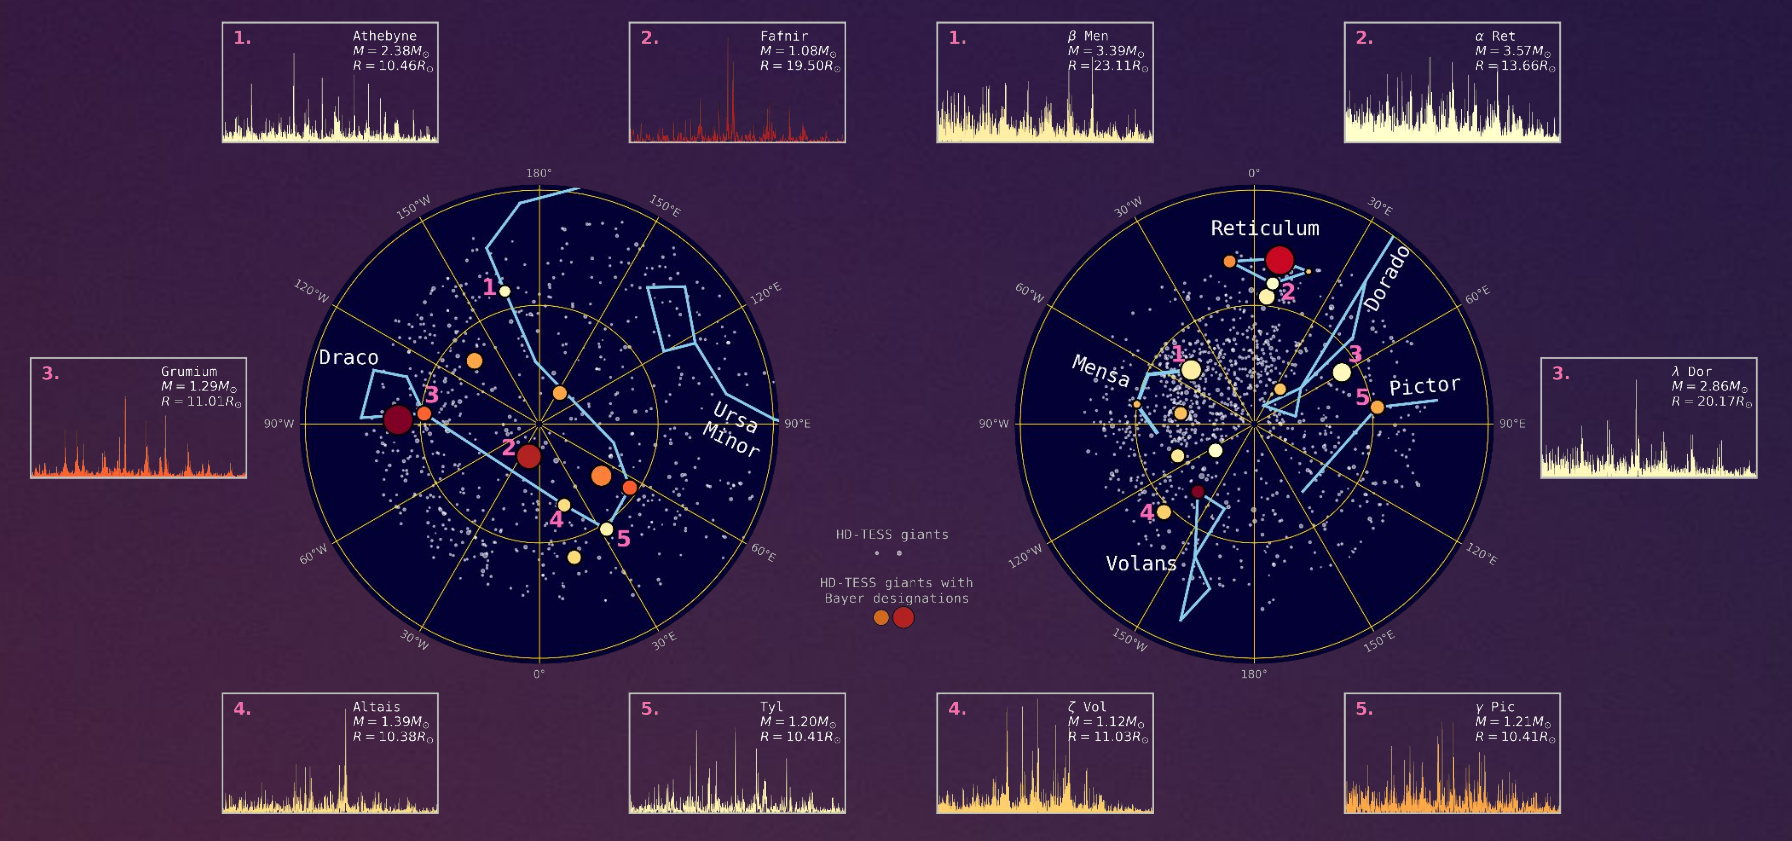
I have published a catalog of asteroseismic masses, radii, and evolutionary states of > 1,500 bright giants with high SNR oscillation spectra in TESS’s Continuous Viewing Zones. The catalog is called HD-TESS, representing the some of the best and the brightest observed by the TESS space mission.
All-Sky Asteroseismology with TESS
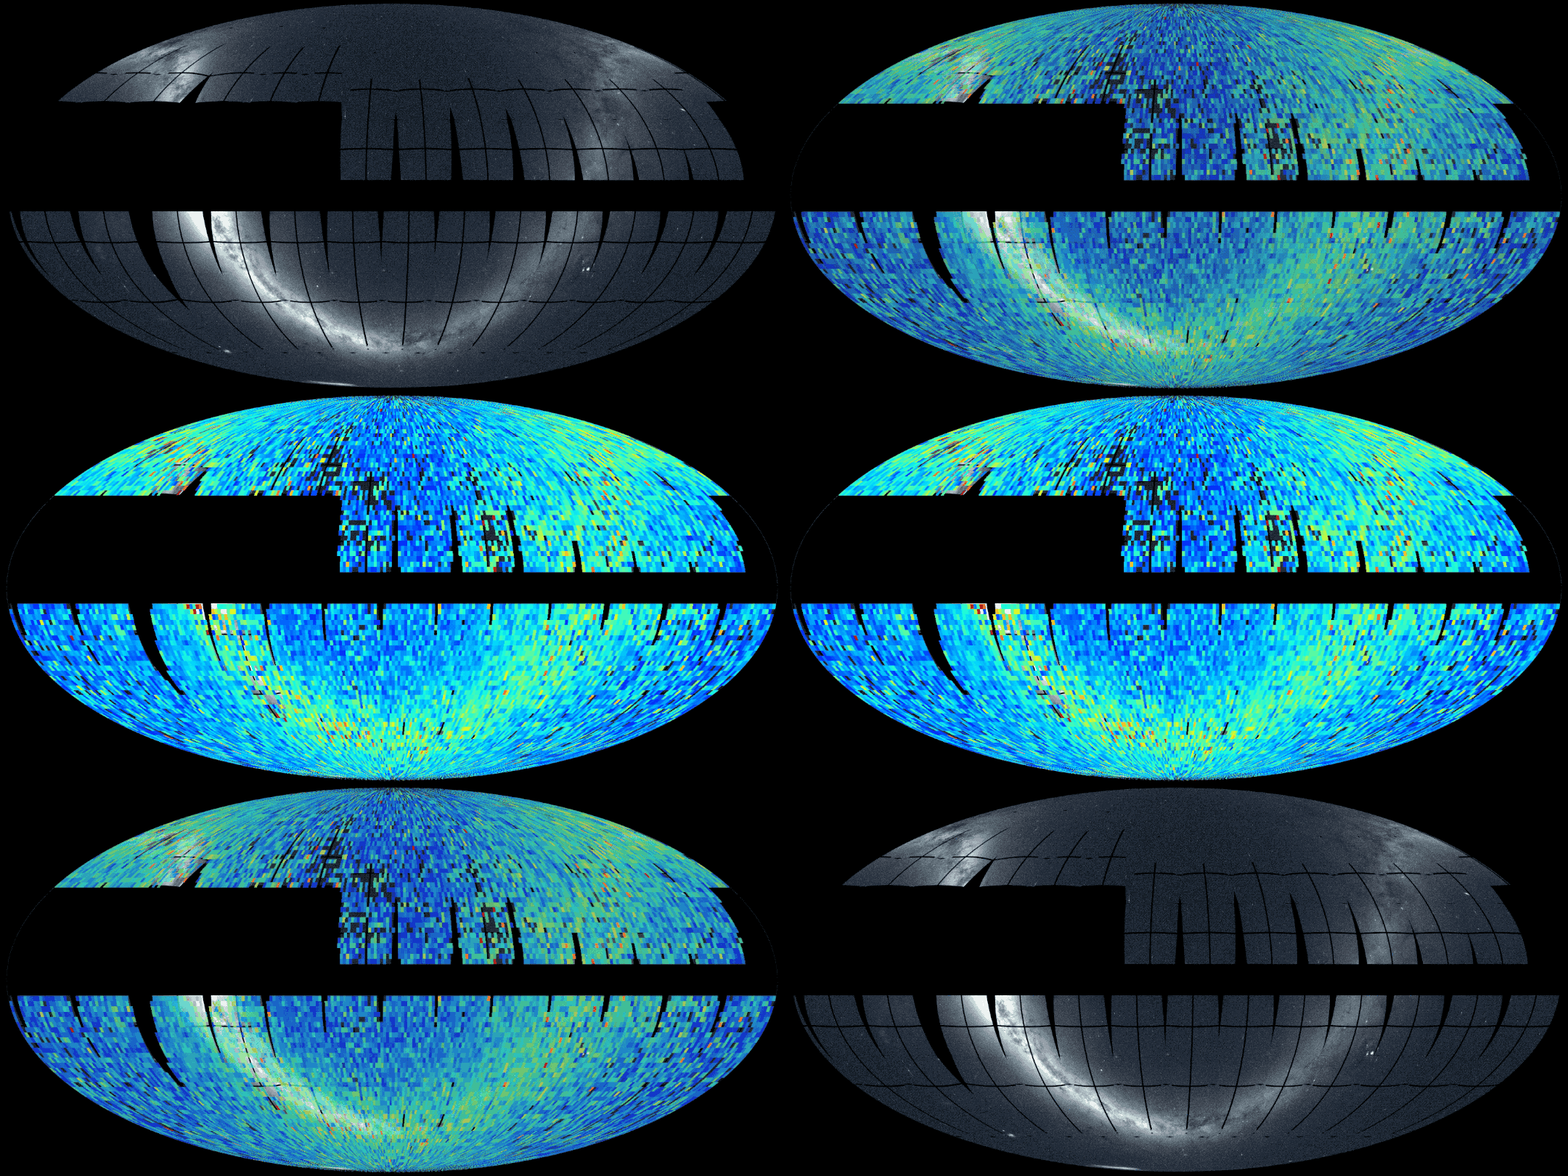
I am interested in mapping the asteroseismology of stellar populations around the entire sky with NASA’s Transiting Exoplanet Survey Satellite. Curiously, we have yet to listen to the pulsations of much of the night sky around us, and my work with TESS seeks to change that.
Computer Vision in Asteroseismology (SLOSH)
In my paper I introduce the Solar-like Oscillations Shape Hunter (SLOSH), which is a 2D convolutional neural network that identifies the presence of red giant oscillations from images of frequency power spectra of stars. Red giant power spectra have very characteristic frequency-power profiles that show rich levels of complexity; this makes it non-trivial for asteroseismic data-fitting pipelines to automatically extract seismic information from a large sample of stars.
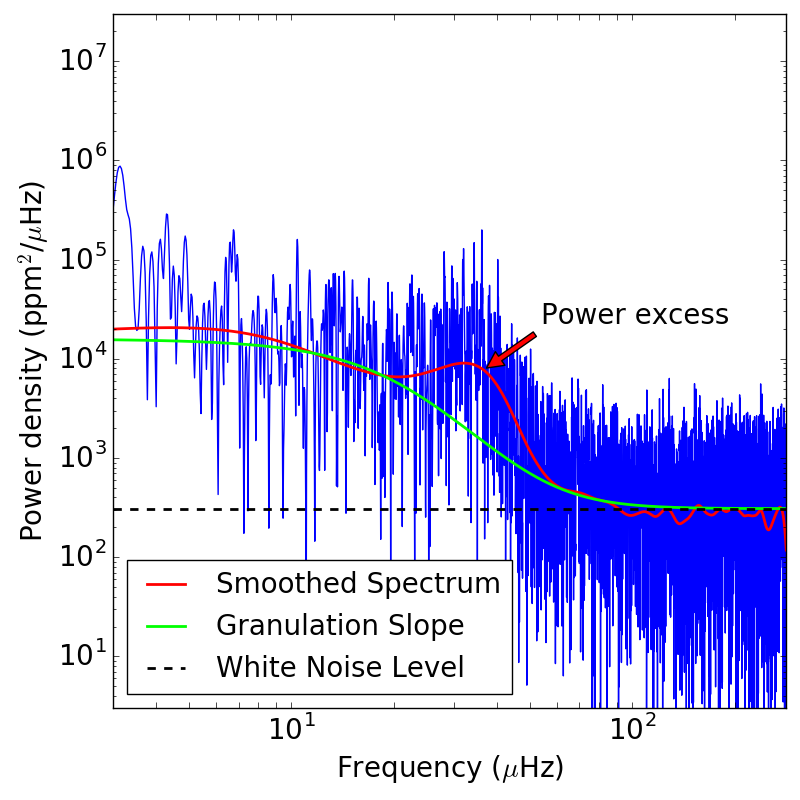
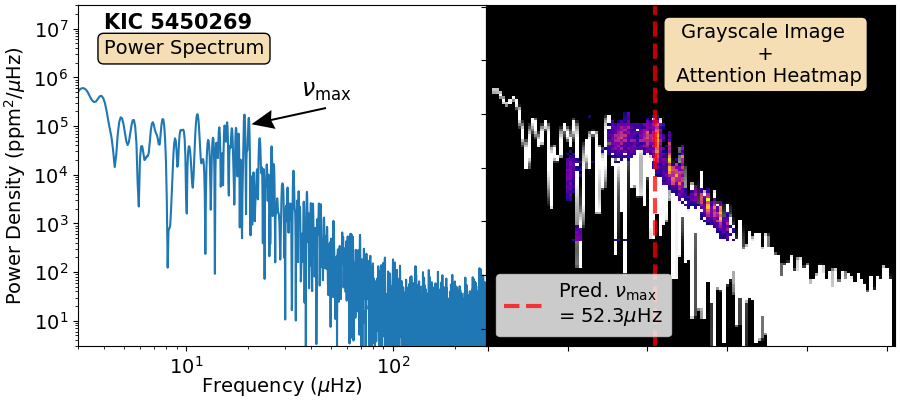
However, the morphology of these power spectra can be easily recognized visually by a human expert. Since convolutional neural networks are powerful deep learning tools that can mimic human visual recognition, SLOSH acts as a ‘machine expert’ that can visually identify oscillations within thousands of stars within seconds.
The lack of any explicit fitting of a mathematical model to power spectra makes SLOSH incredibly flexible. It has been used to find red giants in all Kepler data, and also for asteroseismic target selection in the K2 Galactic Archaeology Program. It is now being implemented for stellar classification on a grand scale with TESS through the TESS Asteroseismic Science Consortium, with an integrated version available here.
What makes SLOSH unique is that it uses a 2D representation - an image - of 1D data (power density) as input. There are a few advantages to such an approach:
- The image representation is analagous to how human experts assess the presence of red giant oscillations - by viewing the plot of the power spectrum in log-log space (see this paper as an example).
- It is easy to handle observations of different length. 4 year Kepler observations have high frequency resolution (high number of frequency bins), while 1 month TESS observations have low frequency resolution (fewer frequency bins). If a 1D neural network is used, the power spectrum must be manually binned for different observation lengths (neural networks typically have a fixed size of its input), and extra care must be taken such that the data is not over-smoothed or too sparse. Using an image representation, however, mitigates this requirement, allowing the network to learn on its own how a power spectrum with more/fewer frequency bins would appear.
The use of 2D representations for 1D data is not a new concept, and methods such as Recurrence Plots and Gramian Angular Fields have been used in literature for 1D time series analyses. SLOSH shows that a suitable choice of data representation goes a long way in training a machine learning model.
Despite its name, SLOSH can also be applied to classify stars showing other forms of variability! The interative plot below shows how SLOSH can separate different stellar types fairly well just by looking at their frequencies. The distances between clusters represent how alike or different the power spectra are.
Red - Delta Scuti/Beta Cepheid; Gray - RR Lyrae/Cepheid; Orange - Constant (No Variability); Green - Contact Binary/Rotation; Pink - Eclipsing Binary; Blue - Aperiodic Variability; Purple - Solarlike Oscillator; Brown - Gamma Doradus/SPB.
Deep Learning Evolutionary State Classifier
Red giants are incredibly useful for a variety of Galactic studies because they are luminous, long-lived, and exist just about anywhere in the Milky Way. As these stars first evolve up the red giant branch (RGB), they burn hydrogen from a shell within the stellar interior. Eventually, they start burning helium in their core (HeB) and become clump stars. Measuring the ages of red giants requires us to know what evolutionary state red giants are in (RGB or HeB); the problem is both types occupy more or less the same temperature and luminosity ranges, making them look very similar from the outside!
While similar on the outside, the interiors of both types of giants are very different! Asteroseismology is the definitive way to differentiate them apart by measuring the period spacing of core-sensitive oscillation modes, which identifies clear differences between the internal structures of both types of stars. However, period spacing measurements require a star’s frequency spectrum to be finely resolved and have high S/N: requirements not often met by stars with shorter observations such as those from K2 or TESS.
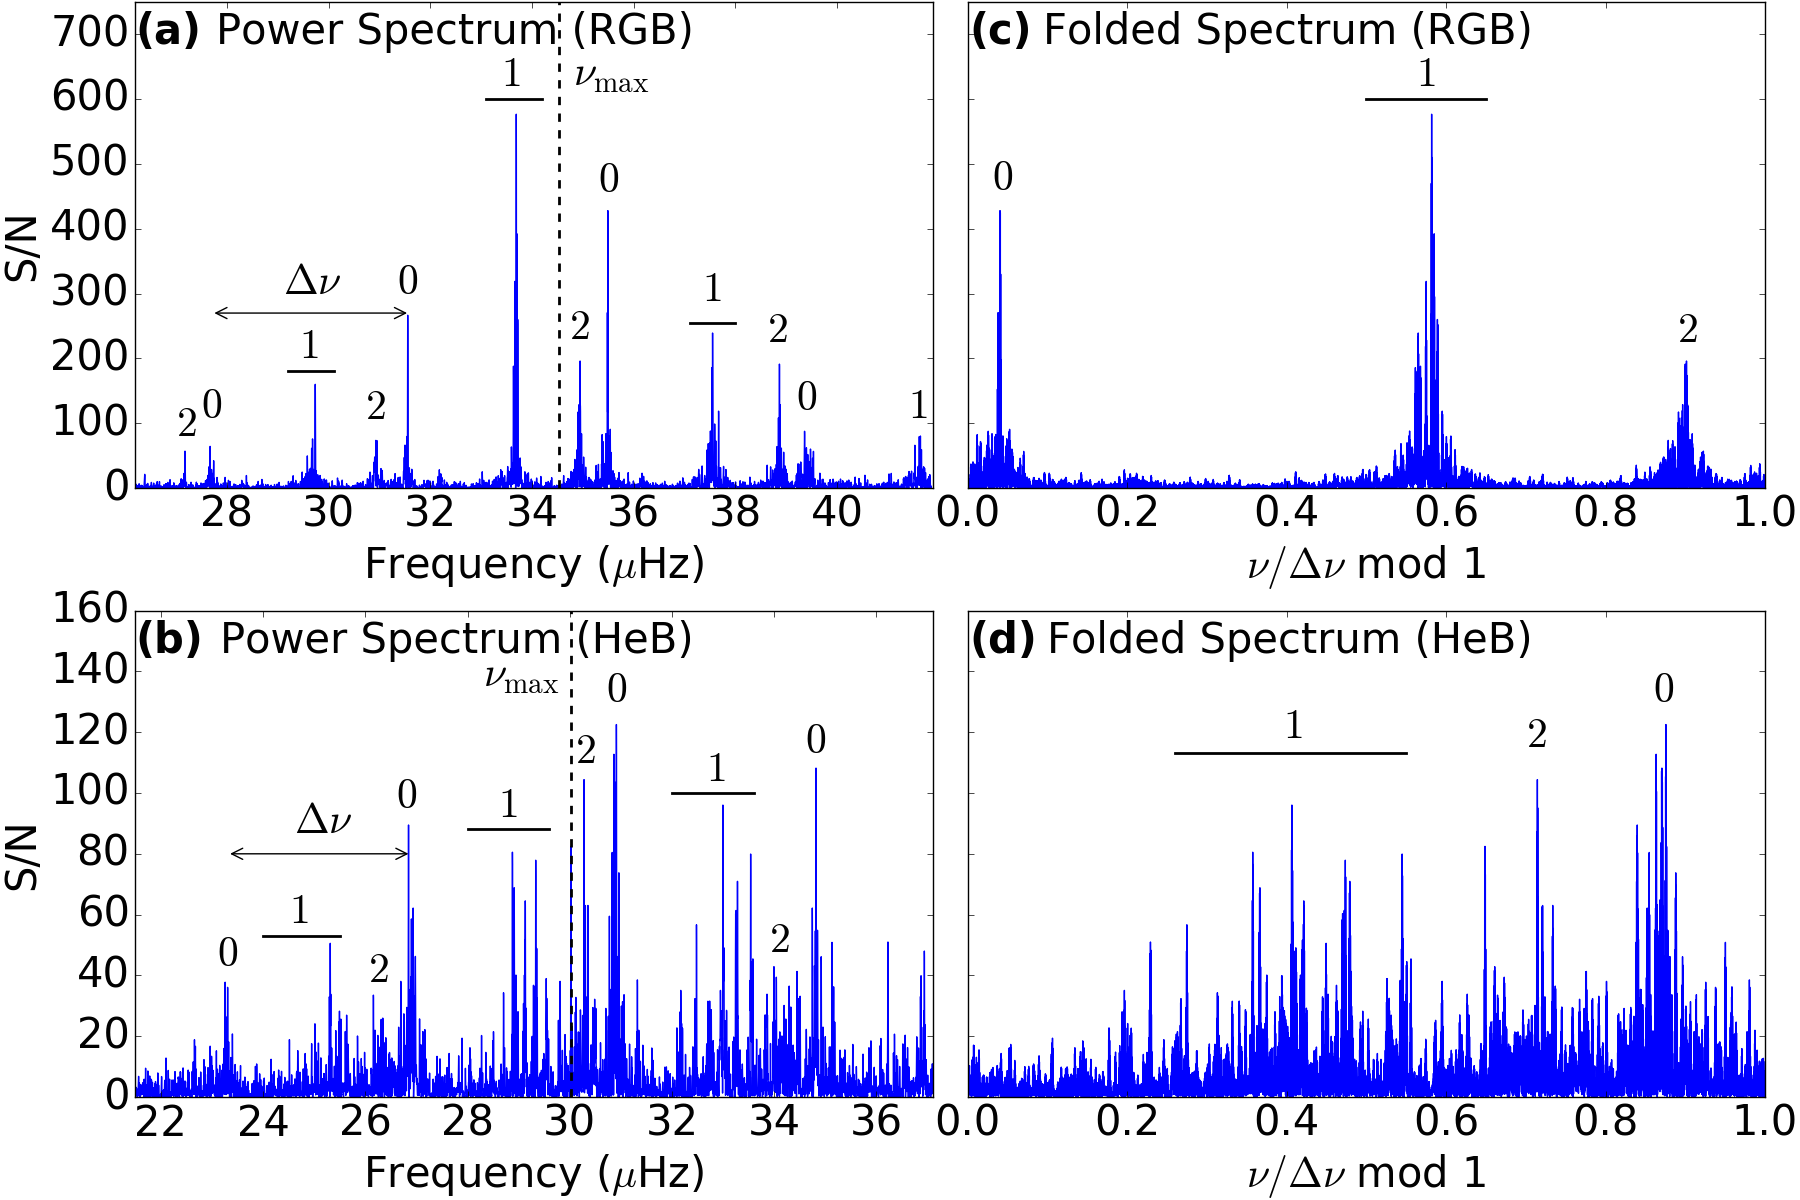
In my work, I train a 1D convolutional neural network to classify the arrangement of core-sensitive oscillation modes – these are very different for more evolved HeB stars as compared to RGB stars. The neural network classifies very well on 4-year Kepler data (99%), and it importantly allows the evolutionary states of vast numbers of red giants to be determined very quickly. In my follow-up work, I apply this to data of low frequency resolution (as low as 1 month’s worth of observations), and find that accuracies over 90% can still be recovered.
This method will soon be updated again to be even more robust to noisy data. It is currently used in the K2 Galactic Archaeology Program, and will soon be applied to TESS data!

